Funnel Analytics gives you a detailed view of how customers interact with your campaign after scanning your QR code. It helps you understand how many customers enter your funnel, how far they progress, how often they click your Share button, and how many ultimately claim your promotion.
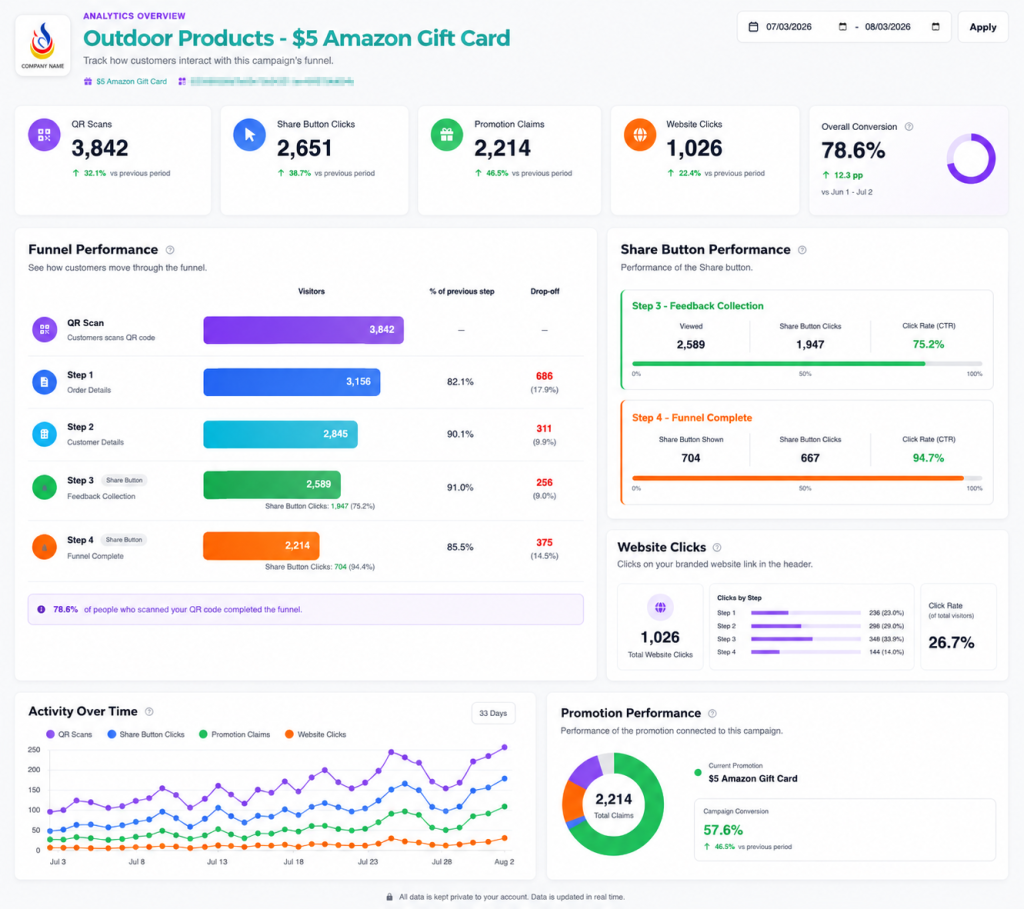
Use this page to identify where customers are dropping off and measure the overall performance of your campaign.
Accessing Funnel Analytics #
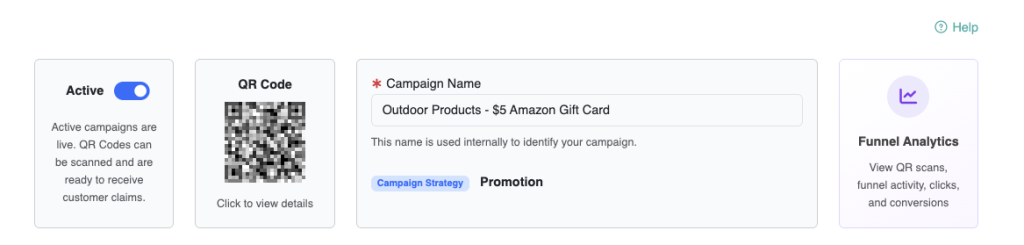
Open the campaign you want to analyze and click on the Funnel Analytics card at the top of the page.
By default, Funnel Analytics displays data from the most recent date range. You can use the date selector at the top of the page to analyze a specific period.
When you select a date range, ReviewScanGo also compares your results with the immediately preceding period of the same length.
For example, if you select the last 30 days, your results will be compared with the 30 days immediately before that period.
Analytics Overview #
At the top of the Analytics page, you’ll see several key performance indicators that provide a quick snapshot of your campaign.

QR Scans #
QR Scans shows the number of times customers entered your campaign by scanning the QR code.
This is the starting point of your funnel and provides the baseline for understanding how customers progress through the campaign.
For example:
1,000 QR Scans means your campaign funnel was entered 1,000 times during the selected date range.
Share Button Clicks #
Share Button Clicks shows the total number of clicks on the Share button across the stages where it is displayed.
Depending on your campaign configuration, customers may have an opportunity to click the Share button during Step 3 – Feedback Collection or Step 4 – Funnel Complete.
The total is calculated as:
Step 3 Share Button Clicks + Step 4 Share Button Clicks
For example, if you have:
- Step 3: 600 clicks
- Step 4: 150 clicks
Your total Share Button Clicks would be 750.
Promotion Claims #
Promotion Claims shows the number of customers who successfully completed the campaign funnel and reached the final step.
For campaigns offering an promotion, such as a gift card, coupon code, digital asset or other option, this represents the number of completed claims during the selected period.
Website Clicks #
If you have enabled a branded website link for your campaign, Website Clicks shows how many times customers clicked that link.
Website clicks can occur at different stages of the funnel. The Website Clicks section provides a breakdown showing where those clicks occurred.
Overall Conversion #
Overall Conversion measures how effectively the Share button converts customers when it is presented during the funnel.
It is calculated using:
Total Share Button Clicks ÷ Total Share Button Opportunities × 100
The Share Button opportunities consist of:
Step 3 Views + Step 4 Share Button Views
For example, suppose your campaign has:
- 800 Step 3 views
- 200 Step 4 Share Button views
- 600 total Share Button clicks
Your Overall Conversion would be:
600 ÷ 1,000 = 60%
This means 60% of the opportunities to click the Share button resulted in a click.
Note: Overall Conversion is different from Promotion Conversion. Overall Conversion measures Share button performance, while Promotion Conversion measures how many QR scans ultimately resulted in a completed promotion claim.
Comparing Performance to the Previous Period #
The percentage shown underneath each primary metric indicates how performance changed compared with the previous equivalent date range.
For example:
↑ 28.7% vs previous period
means the metric increased by 28.7% compared with the preceding period.
For conversion rates, changes may be displayed in percentage points (pp).
For example:
If conversion increased from 65% to 75%, the dashboard would show an increase of:
+10 percentage points
rather than a 10% relative increase.
Funnel Performance #
The Funnel Performance section shows how customers move through each stage of your campaign.
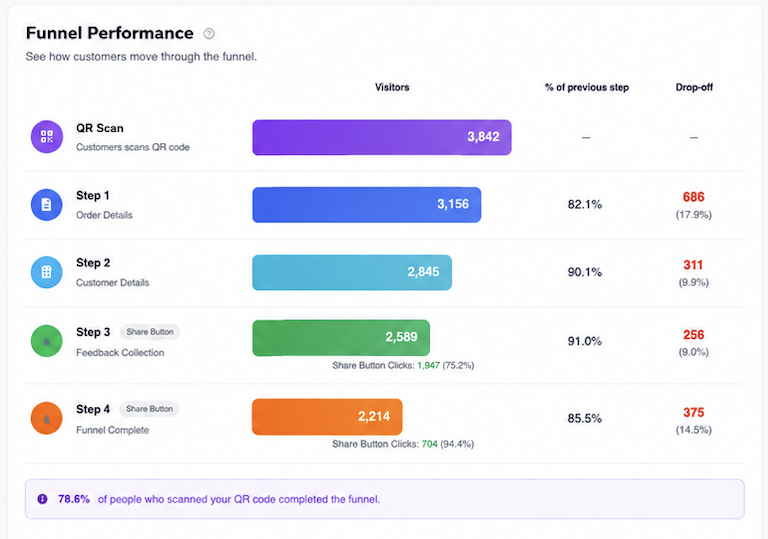
This is especially useful for identifying where customers leave the funnel before completing it.
The funnel begins with the QR scan and then follows customers through each configured step.
QR Scan #
The QR Scan row represents customers entering your funnel.
This is the starting point against which Step 1 is measured.
Step 1 – Order Details #
Step 1 collects information related to the customer’s order.
The dashboard shows:
Visitors – Number of times customers reached Step 1.
% of previous step – Percentage of QR scans that continued to Step 1.
Drop-off – Number and percentage of customers who entered the funnel but did not continue to Step 1.
Step 2 – Customer Details #
Step 2 collects customer information required to continue the campaign.
Its conversion percentage is calculated relative to Step 1.
For example:
If 1,000 customers reach Step 1 and 900 reach Step 2:
900 ÷ 1,000 = 90%
The remaining 100 customers represent a 10% drop-off.
Step 3 – Feedback Collection #
Step 3 is where customer feedback is collected.
The Funnel Performance section shows how many customers reached this step and how many continued from Step 2.
If the Share button is available during Step 3, you’ll also see the number of Share Button clicks and the corresponding click rate.
For example:
Share Button Clicks: 750 (75.0%)
means 75% of the customers who reached Step 3 clicked the Share button.
Step 4 – Funnel Complete #
Step 4 represents customers who successfully reached the end of the funnel.
For campaigns with promotions, reaching this stage generally represents a completed promotion claim.
Some customers may also be shown the Share button on this page.
The analytics separately track how many customers were shown the button and how many clicked it.
Understanding Drop-Off #
Drop-off shows how many customers failed to continue from one funnel stage to the next.
For example:
If:
Step 1 Visitors: 1,000
Step 2 Visitors: 900
Then:
Drop-off: 100 customers (10%)
High drop-off at a particular step can help you identify areas of the funnel that may need improvement.
Share Button Performance #
The Share Button Performance section provides a more detailed look at customer interaction with the Share button.
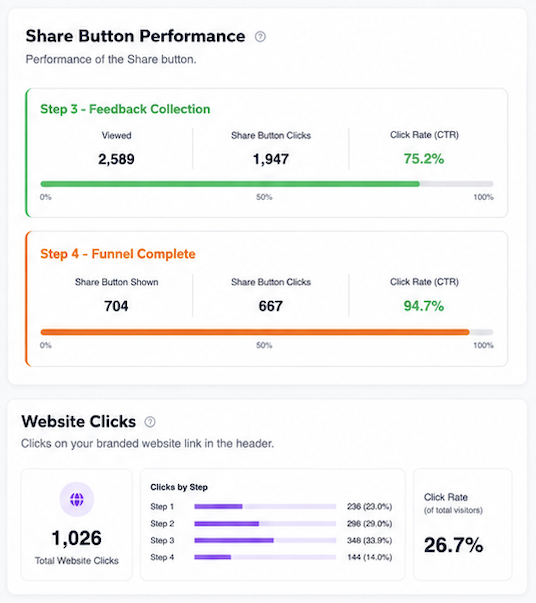
Performance is separated between Step 3 and Step 4 because customers may encounter the button at different points in the funnel.
For example, if you have the Smart Reviews option enabled in your campaign settings, customers may be shown the share button based on their feedback score from step 1. If you disabled the Smart Reviews option, then the share button is always shown on step 3.
If the customer does not click the Share button on step 3, the share button will be displayed again on step 4 to provide another opportunity for the customer to share their review on your web store.
If the customer clicked the Share button on step 3, the share button will not be displayed again on step 4.
Step 3 – Feedback Collection #
The Step 3 card displays:
Viewed – Number of customers who reached Step 3.
Share Button Clicks – Number of clicks generated during Step 3.
Click Rate (CTR) – Percentage of Step 3 views that resulted in a Share button click.
The calculation is:
Step 3 Share Button Clicks ÷ Step 3 Views × 100
Step 4 – Funnel Complete #
Not every customer who reaches Step 4 will necessarily be shown the Share button.
For example, a customer who already interacted with the Share button during Step 3 may not need to see it again.
For this reason, Step 4 tracks Share Button Shown separately.
The Step 4 card displays:
Share Button Shown – Number of customers who were presented with the Share button on Step 4.
Share Button Clicks – Number of customers who clicked it.
Click Rate (CTR) – Percentage of displayed Share buttons that resulted in a click.
The calculation is:
Step 4 Share Button Clicks ÷ Step 4 Share Button Shown × 100
This provides a more accurate measurement of Step 4 performance than using all customers who completed the funnel.
Website Clicks #
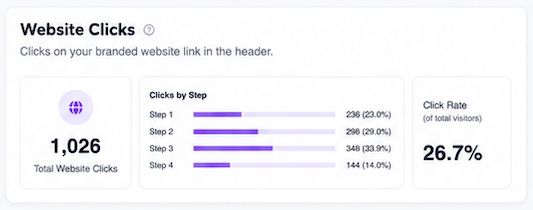
The Website Clicks section tracks engagement with your branded website link.
If website tracking is available for your campaign, you’ll see:
Total Website Clicks – Total number of website-link clicks generated throughout the funnel.
Clicks by Step – Shows whether the click occurred during Step 1, Step 2, Step 3, or Step 4.
Click Rate – Percentage of QR scan visitors who clicked your website link.
The click rate is based on unique website visitors, which prevents one customer who clicks the website link multiple times from artificially inflating the percentage.
Activity Over Time #
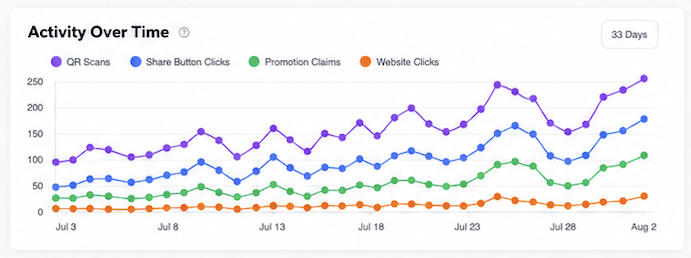
The Activity Over Time chart shows campaign activity for each day within your selected date range.
The chart can include:
- QR Scans
- Share Button Clicks
- Promotion Claims
- Website Clicks
This makes it easier to identify trends and spikes in activity.
For example, you may notice increased QR scans shortly after a large batch of orders is delivered.
You can also compare activity types to see how increases in QR scans translate into Share Button clicks and promotion claims.
Promotion Performance #
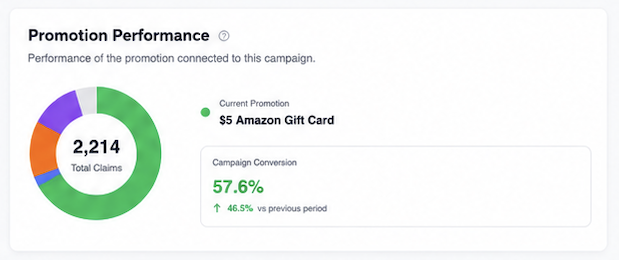
The Promotion Performance section focuses specifically on the promotion attached to your campaign.
It displays the current promotion, total number of claims, and the promotion’s conversion rate.
Promotion Conversion #
Promotion Conversion measures how many customers who scanned your QR code ultimately completed the promotion claim.
It is calculated as:
Promotion Claims ÷ QR Scans × 100
For example:
If your campaign receives:
1,000 QR Scans
and:
850 Promotion Claims
then your Promotion Conversion is:
850 ÷ 1,000 = 85%
A high Promotion Conversion indicates that customers who enter your funnel are successfully progressing through the process and claiming the promotion.
Overall Conversion vs. Promotion Conversion #
These two percentages measure different parts of your campaign and should not be confused.
| Metric | What It Measures | Calculation |
|---|---|---|
| Overall Conversion | Share button engagement | Share Button Clicks ÷ Share Button Opportunities |
| Promotion Conversion | Successful promotion completion | Promotion Claims ÷ QR Scans |
For example, a campaign could have an Overall Conversion of 75% and a Promotion Conversion of 88%.
This simply means 75% of Share button opportunities generated clicks, while 88% of customers who scanned the QR code ultimately completed their promotion claim.
Using Funnel Analytics to Improve Your Campaign #
Rather than focusing on a single number, look at how the metrics work together to understand how customers are responding to your campaign.
A healthy campaign will generally show strong engagement from the initial QR scan through promotion completion, with relatively low drop-off along the way.
While the funnel steps themselves are standardized and cannot be changed, your analytics can help you identify opportunities to improve the elements of your campaign that you can control.
If you’re looking to improve performance, consider testing changes to:
- Insert Card Design – Make sure your card is visually appealing, easy to understand, and draws attention to the QR code.
- Insert Card Call-to-Action (CTA) – A clear and compelling CTA can encourage more customers to scan the QR code and begin the funnel.
- Promotion Title – Make the value of your promotion immediately clear so customers understand what they can receive.
- Incentive or Offer – A more attractive or relevant incentive may encourage more customers to participate and complete the funnel.
For example, if you’re distributing a large number of insert cards but seeing relatively few QR scans, consider testing a different card design or CTA.
If customers are scanning the QR code but your Promotion Conversion is lower than expected, consider whether your promotion title and incentive clearly communicate enough value to motivate customers to complete the process.
You should also compare Share Button Performance with Promotion Conversion to understand the difference between customers completing your promotion and customers engaging with the Share button.
When you make changes, use the date filter and previous-period comparisons to measure performance before and after the change. This can help you determine whether adjustments to your insert card, CTA, promotion title, or incentive are improving campaign performance over time.